I recently discovered that fancy indexing is not that fast in Python. If you do a lot of it, it can eat up some valuable computational time. So I benchmarked the different approaches I know:
- Just extracting the vectors using a True-False vector
- Using the np.where command on the True-False vector
- Using the np.take command on the np.where on the True-False vector
- (I also tried np.take on just the True-False vector. It is really slow and is to be avoided)
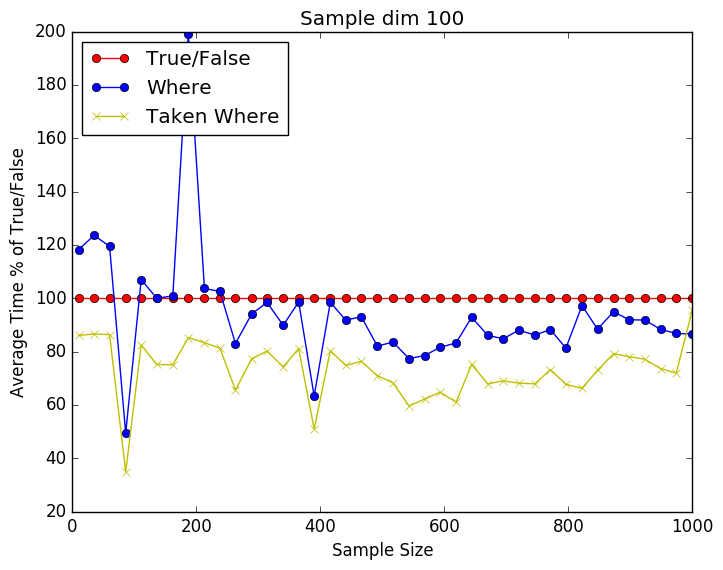
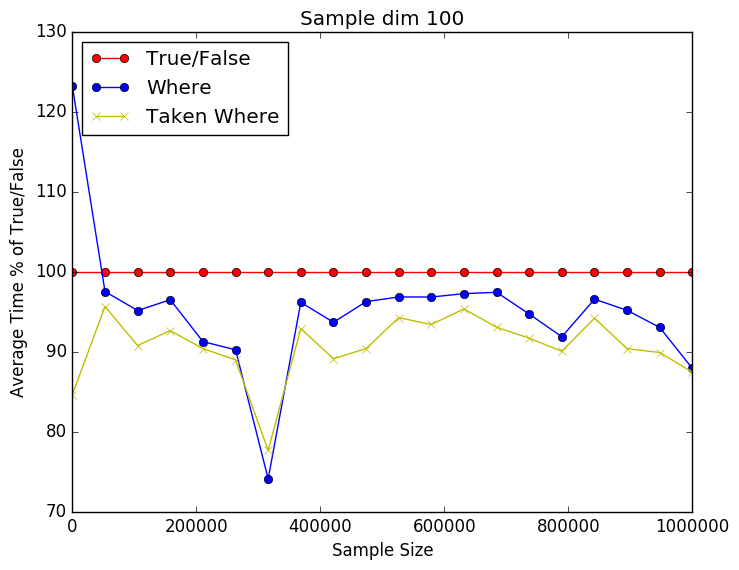
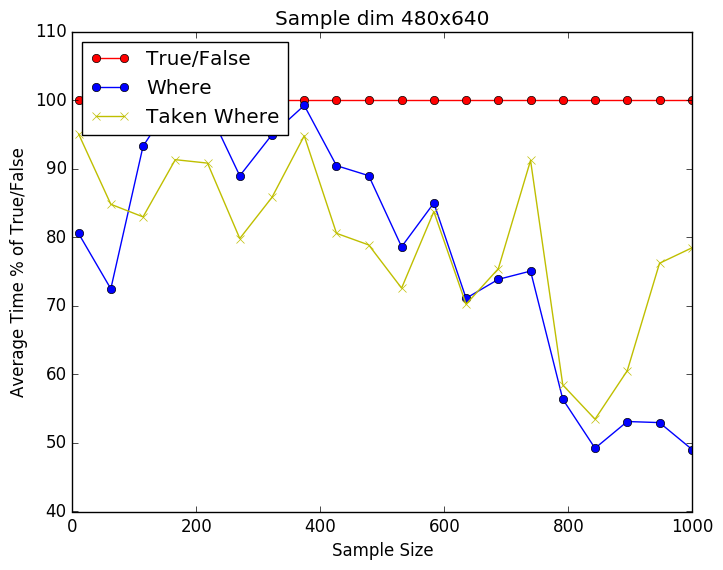
From the plots below we can see that it is a close call between the where and np.take using np.where. Still perecent wise np.take has a slight advantage over just using np.where. As the number of dimensions gets higher the difference seems to be getting smaller. This might be due to the internal workings of np.take. I have included the source code below as well.
import time import numpy as np import matplotlib.pyplot as plt Nmax = 1E6 Niters = 100 pts = 20 dims = 100 runtime = np.zeros((4,pts)) for idx,Npts in enumerate(np.linspace(10,Nmax, num=pts,dtype=int)): for ii in xrange(0,Niters): X = np.random.rand(Npts,dims) y = np.random.randint(2, size=Npts) t0 = time.time() idxs = y == 1 X1 = X[idxs,:] t1 = time.time() runtime[0,idx] += t1-t0 del t0 del t1 del X1 del idxs t0 = time.time() idxs = np.where(y == 1) X1 = X[idxs,:] t1 = time.time() runtime[1,idx] += t1-t0 del t0 del t1 del X1 del idxs # Sloooow # t0 = time.time() # idxs = y == 1 # X1 = np.take(X,idxs,axis=0) # t1 = time.time() # runtime[2,idx] += t1-t0 # del t0 # del t1 # del X1 # del idxs t0 = time.time() idxs = np.where(y == 1) X1 = np.take(X,idxs,axis=0) t1 = time.time() runtime[3,idx] += t1-t0 del t0 del t1 del X1 del idxs print runtime s = np.linspace(10,Nmax, num=pts,dtype=int) runtime = 100 * (runtime/runtime[0,:]) plt.plot(s,vals[0,:],'ro-',label='True/False') plt.plot(s,vals[1,:],'bo-',label='Where') # plt.plot(s,vals[2,:],'gx-',label='Taken True/False') plt.plot(s,vals[2,:],'yx-',label='Taken Where') plt.xlabel('Sample Size') plt.ylabel('Average Time % of True/False') plt.legend(loc=2) plt.title('Sample dim 100') plt.savefig('whereprofile.png', format='png', bbox_inches="tight") plt.show() |